
Portfolio / Case study 03

DashboardsSQLAutomation

Financial BI dashboard

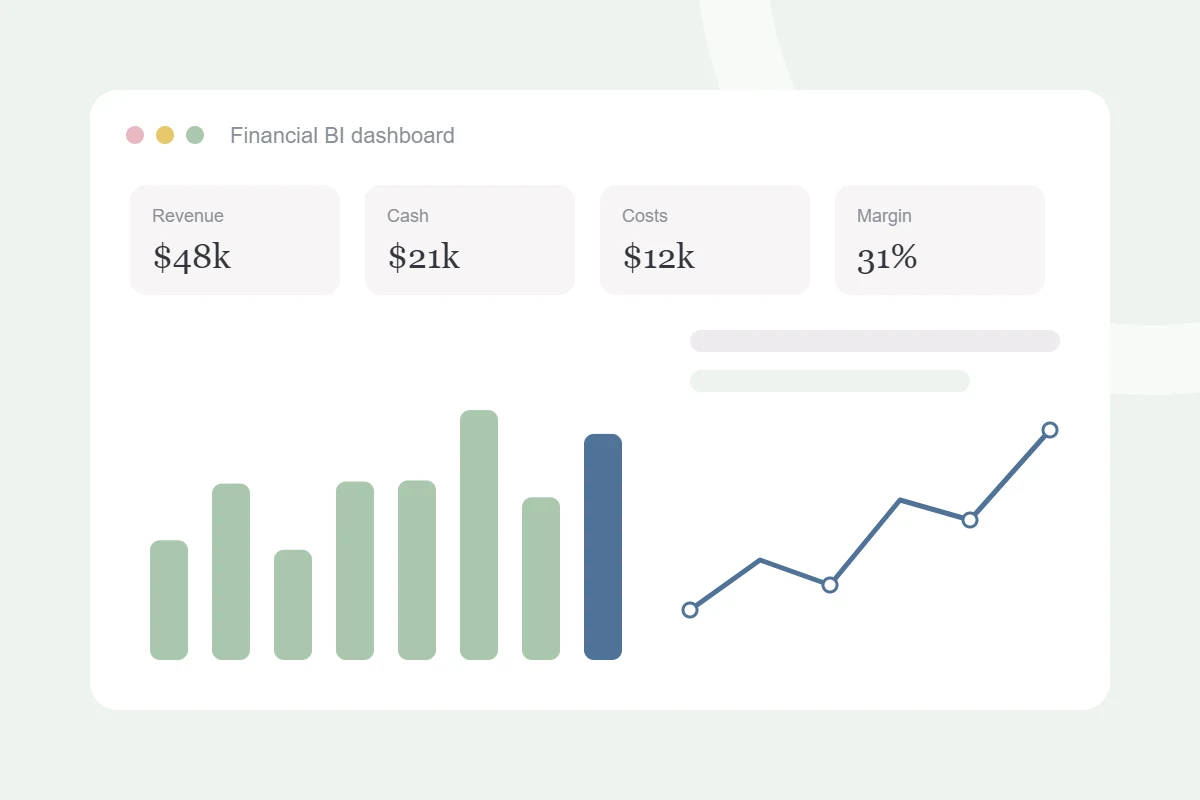
Financial reporting pulled straight from source data with SQL and Python, then presented in Power BI for the monthly review.
ClientIntellifyx
IndustryTechnology services
My roleFinancial analyst
ToolsPower BI, SQL, Python
Financial BI dashboard for Intellifyx

Project walkthrough

See how the work was put together

Financial BI dashboardClick to play
finzain · project log

$ start project "Financial BI dashboard"

✓ Brief agreed with Intellifyx

✓ Wrote SQL queries to pull ledger and billing data

✓ Cleaned and joined the data with Python

✓ Built Power BI pages for revenue, costs and margins

→ Review with the client…

● Delivered and handed over

The project

Problem, approach and result

01

The challenge

Monthly reports were rebuilt by hand from exports, which took days and made it easy for small errors to slip through.

02

What I did

  • Wrote SQL queries to pull ledger and billing data
  • Cleaned and joined the data with Python
  • Built Power BI pages for revenue, costs and margins
03

The result

The monthly report refreshed from the source data, and review meetings started from the same numbers for everyone.

Gallery and links

Screens from the project

Figures are anonymised. Click an image to enlarge it.
Financial BI dashboard main screen
Main view
Financial BI dashboard detail screen
Detail
Financial BI dashboard report screen
Report

Let's connect

Want something like this for your business?

Book a free 30-minute call on Google Meet, or reach me directly.