Portfolio / Case study 03

DashboardsSQLAutomation

Financial BI dashboard

Financial reporting pulled straight from source data with SQL and Python, then presented in Power BI for the monthly review.
ClientIntellifyx
IndustryTechnology services
My roleFinancial analyst
ToolsPower BI, SQL, Python
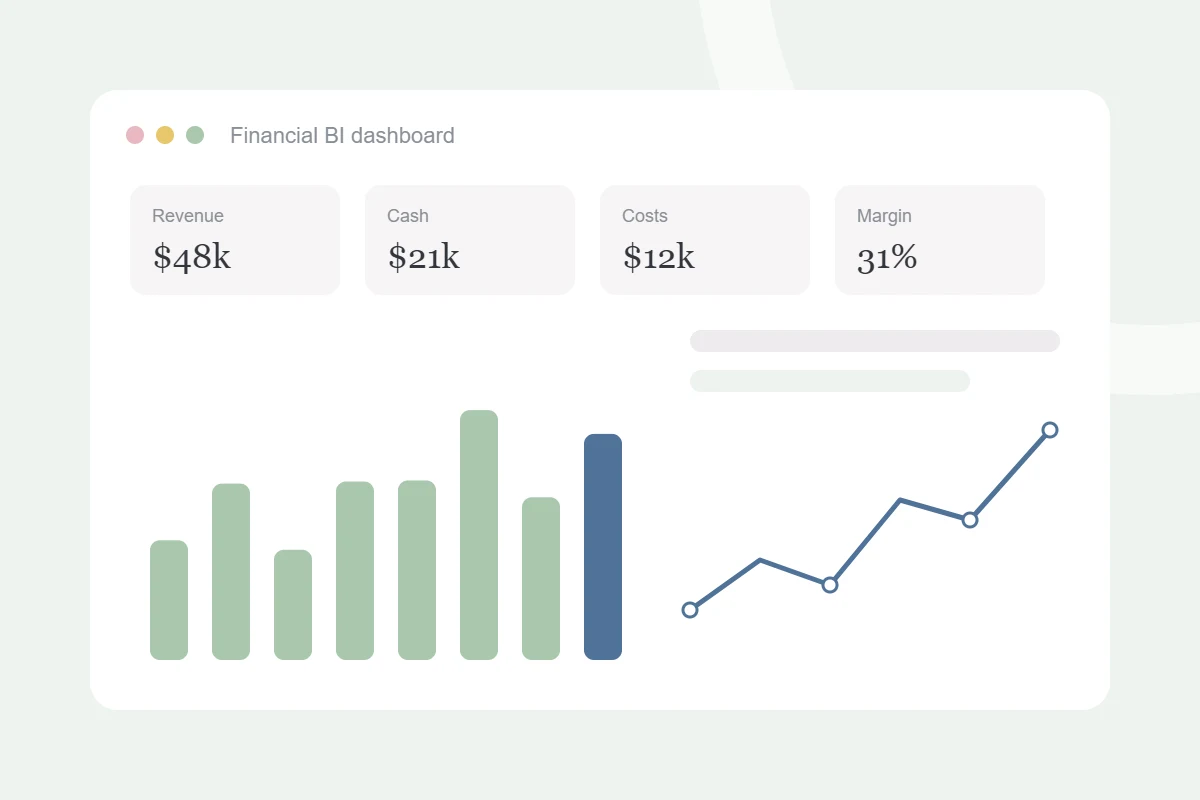
Financial BI dashboard for Intellifyx

Project walkthrough

See how the work was put together

Financial BI dashboard for Intellifyx, project walkthrough
Financial BI dashboardClick to play
finzain · project log

$ start project "Financial BI dashboard"

✓ Brief agreed with Intellifyx

✓ Wrote SQL queries to pull ledger and billing data

✓ Cleaned and joined the data with Python

✓ Built Power BI pages for revenue, costs and margins

→ Review with the client…

● Delivered and handed over

The project

Problem, approach and result

01

The challenge

Monthly reports were rebuilt by hand from exports, which took days and made it easy for small errors to slip through.

02

What I did

  • Wrote SQL queries to pull ledger and billing data
  • Cleaned and joined the data with Python
  • Built Power BI pages for revenue, costs and margins
03

The result

The monthly report refreshed from the source data, and review meetings started from the same numbers for everyone.

From manual exports to a report that refreshes

The monthly report used to be rebuilt by hand from exports, which meant the same copy and paste steps every month and a real chance of a small error slipping through. My goal was to take people out of that loop. Instead of rebuilding the report, the team would open one that already knew where the data lived and refreshed itself from the source.

Getting there meant separating the work into clear stages: pull the data, clean it, then present it. Keeping those stages apart also makes the report easier to check, because if a figure looks wrong you can see which stage it came from.

Why SQL and Python come before Power BI

Power BI is excellent at presenting numbers, but it works best when the data arrives clean. I wrote SQL queries to pull the ledger and billing data directly from the source, then used Python to clean and join it. That step handles the problems that cause most reporting errors:

  • Customer names written in slightly different ways
  • Dates and currencies stored in different formats
  • Duplicate rows from overlapping exports
  • Records that exist in billing but not yet in the ledger

What the team gained

With the report refreshing from the source, review meetings started from the same numbers for everyone, and the discussion moved from whether a figure was right to what it meant. The pages for revenue, costs and margins were designed to be read in a few minutes before a meeting.

This kind of setup suits any business that closes its books monthly and still builds the report by hand. If that sounds familiar, I can look at what your reporting process involves and suggest where automation would save the most time.

Gallery and links

Screens from the project

Figures are anonymised. Click an image to enlarge it.
Financial BI dashboard main screen
Main view
Financial BI dashboard detail screen
Detail
Financial BI dashboard report screen
Report

Let's connect

Want something like this for your business?

Book a free 30-minute call on Google Meet, or reach me directly.